Saving browser logs
Most errors that occur in the LMS are automatically reported with all required information for fixing them.
There are some, however, that are inaccessible to the LMS, for example network errors and errors occurring within the learning materials or external services.
In those cases we might ask you to send us the logs from the Developer Console of your browser. It only contains data for the page you have opened (the LMS).
In this section
- Opening the developer console
- Enabling relevant tabs
- Trigger the issue
- Save the logs
- Send the logs to Datafisher
Opening the developer console
First, you need to go to the LMS, and open the Developer Tools.
It depends on your browser how exactly that is done.
- Chrome
- Firefox
- Edge
Press CTRL+SHIFT+i (Windows, Linux) or CMD+SHIFT+i (Mac).
Alternatively, you can right click anywhere on the LMS page and select "Inspect".
Or, you can click on three dots icon to open the Chrome menu, and under "More Tools" select "Developer tools".
Press CTRL+SHIFT+i (Windows, Linux) or CMD+SHIFT+i (Mac).
Alternatively, you can right click anywhere on the LMS page and select "Inspect".
Or, you can click on hamburger icon to open the Firefox menu, and under "More Tools" select "Web Developer tools".
Press CTRL+SHIFT+i (Windows, Linux) or CMD+SHIFT+i (Mac).
Alternatively, you can right click anywhere on the LMS page and select "Inspect".
Or, you can click on three dots icon to open the Edge menu, and under "More Tools" select "Developer tools".
Enabling relevant tabs
- Chrome
- Firefox
- Edge
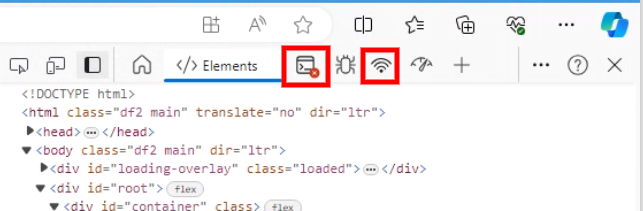
Next, click on the "Console" tab and then on the "Network" tab to make sure they are activated.
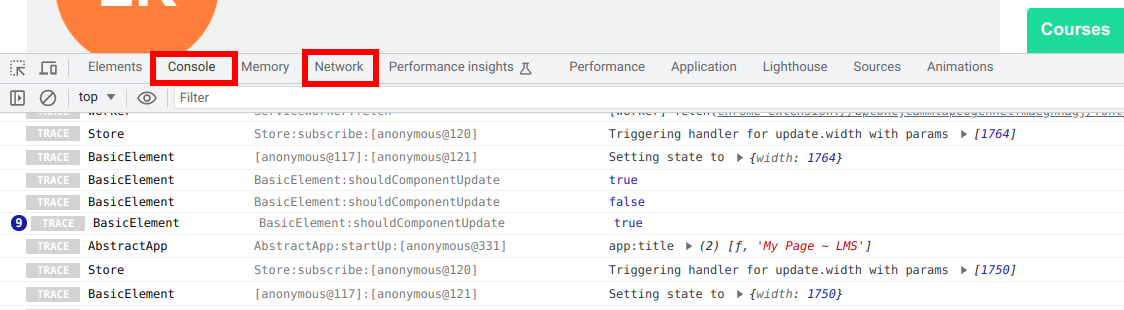
Next, click on the "Console" tab and then on the "Network" tab to make sure they are activated.
Next, click on the "Console" tab and then on the "Network" tab to make sure they are activated.
Trigger the issue
Next, try to trigger the issue you are having.
For example, if you have a problem that a training does not open, try opening it and wait a few seconds.
Save the logs
Next, save the Console and Network logs from the Developer Tools.
- Chrome
- Firefox
- Edge
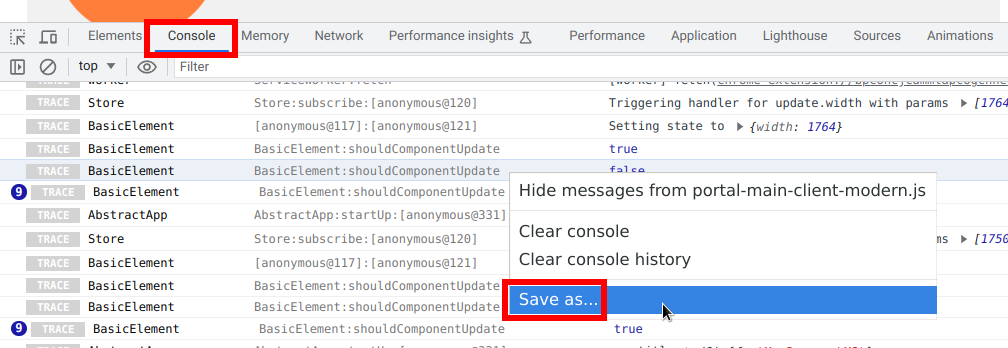
In order to save the Console logs:
- open the Console tab,
- right click anywhere on the logs,
- select "Save as...",
- and save the logs into your computer.
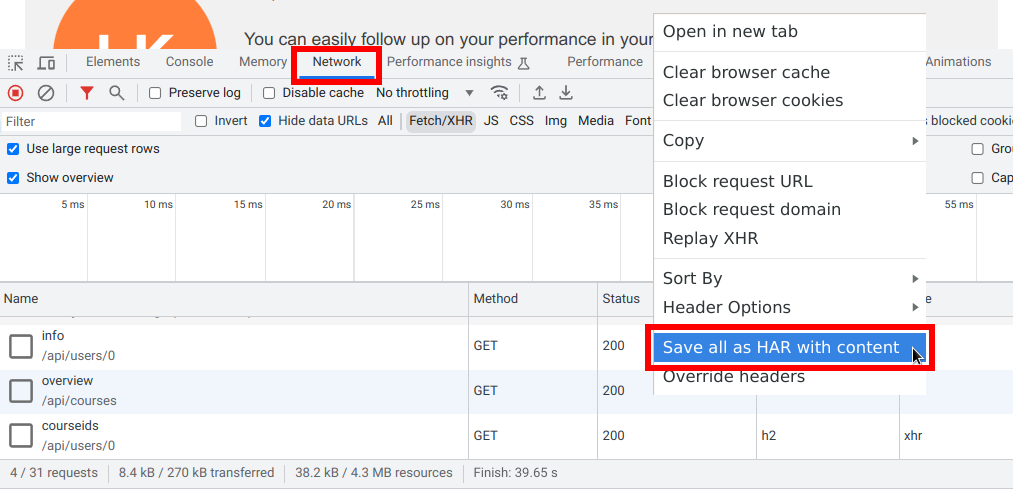
In order to save the Network logs:
- open the Network tab,
- right click anywhere on the logs,
- select "Save all as HAR with content",
- and save the logs into your computer.
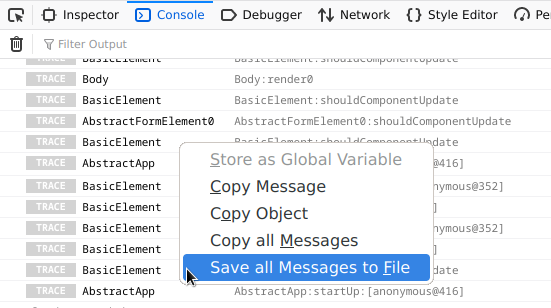
In order to save the Console logs:
- open the Console tab,
- right click anywhere on the logs,
- select "Save all Messages to File...",
- and save the logs into your computer.
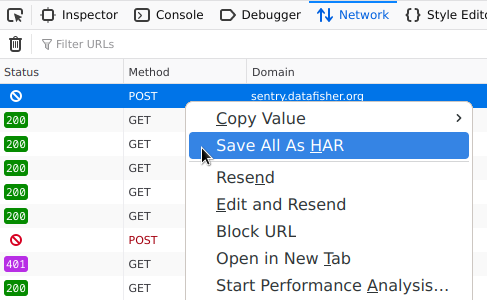
In order to save the Network logs:
- open the Network tab,
- right click anywhere on the logs,
- select "Save all as HAR",
- and save the logs into your computer.
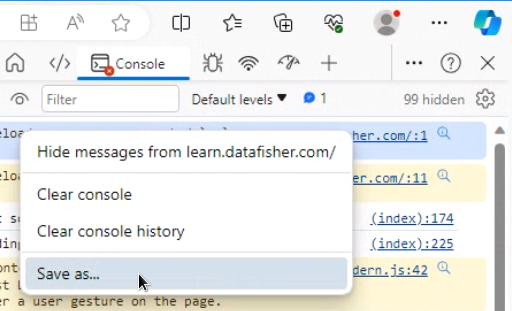
In order to save the Console logs:
- open the Console tab,
- right click anywhere on the logs,
- select "Save as...",
- and save the logs into your computer.
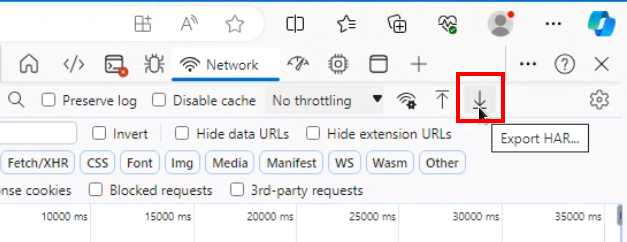
In order to save the Network logs:
- open the Network tab,
- click on the arrow down button on the top right ("Export HAR...")
- and save the logs into your computer.
Send the logs to Datafisher
Finally, send the logs as attachments to support@datafisher.com along with a description of your issue.