Advanced reports
Advanced reporting provides you access to all available reporting features.
Advanced reports are available from the simple reporting interface with the Advanced mode action.
The Simple mode action switches back to the simple reporting interface when the selected report options are compatible with simple mode.
The content of all reports is limited by the permissions granted to the administrator viewing (receiving) them.
For example, when a user who has access to only Finnish users views a report about the whole company, they will see results only containing the Finnish users.
In this section
- Results overview – how to interpret the results
- Contents and scope – select the The fallback content to display on prerenderingincluded in the report, which assignees to include, and view per-content results
- Organization view – drill down into your organization
- Target employee group – further narrow down the target group
- Activity – view a graph of daily or monthly activity
- Aggregate results by field – view results by a user field, e.g. per each business unit
- Detailed results – list all relevant users and their completion status
- Detailed aggregate results – list all relevant users and how many of the selected The fallback content to display on prerenderingthey have completed
- Aggregate completion status – show results by completion status
- Report options – miscellaneous options
- Save and schedule email report – save the report for later access and schedule it to be sent to your email address
Results overview
First, you need to select the
Once a
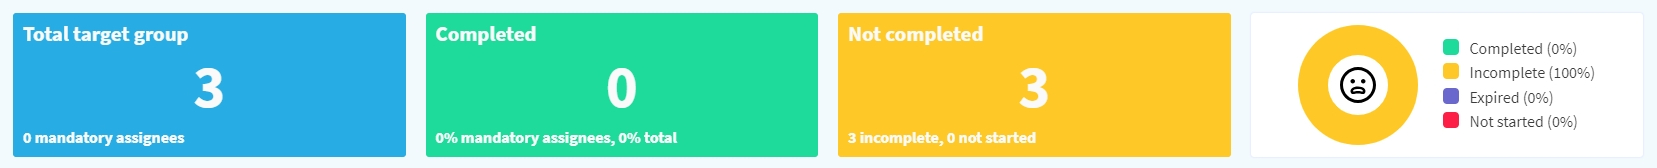
- Total target group – everyone in the report scope excluding anyone not matching the target employee group filters.
- Completed – the number of users who have The fallback content to display on prerenderingthe training.
- Not completed – the number of users who have not started the training or whose training is incomplete.
- Pie chart
- Completed – the percentage of users that have completed the training.
- Incomplete – the percentage of users that have not started the training or it is incomplete.
- Expired – the percentage of users whose completion has expired.
- Not started – the percentage of users who have not started the content(s).
In case of having selected multiple
Contents and scope
In this section:
- Contents – the The fallback content to display on prerenderingor categories you want to view the results for.
- Report scope – which assignees to include in the report.
- Completion type – how to determine completion of multiple The fallback content to display on prerendering(when multiple are selected).
- Per-content results – per-content results (when multiple are selected).
Contents
Here you can select the
- Select content(s) – select one The fallback content to display on prerendering, multipleThe fallback content to display on prerendering, or a contentThe fallback content to display on prerenderingthat includes all contents under the category.
- Archived – include The fallback content to display on prerenderingThe fallback content to display on prerenderingin content selection.
Report scope
Here you can select which users to include in the report:
- Include mandatory assignees – include users assigned to the content as mandatory.
- Include recommended assignees – include users assigned to the content as recommended.
- Include optional assignees – include users assigned to the content as optional.
- Everyone who has started the content – include users who have started the content.
At least one of the options must be selected, otherwise the report will be empty.
Completion type
(only visible when multiple contents have been selected)
Here you can select what "completed" means:
- The user must have completed all the selected contents – count a user as completed only when all selected contents are completed.
- The user must have completed any of the selected contents – useful for equivalent trainings or trainings that have simple and advanced versions.
Per-content results
(only visible when multiple contents have been selected)
Per-content results show a table with the results for each selected content.
The table shows columns such as Name, Total, Completed, Incomplete, Expired, and Not started:
- Name – the content name.
- Total – the target group size for the content.
- Completed – the number and percentage of completions.
- Incomplete – the number and percentage of incomplete users.
- Expired – the number and percentage of expired completions, when expiration is included.
- Not started – the number and percentage of users who have not started the content.
Organization view
In this section you can easily drill down into the very lowest levels your organization.
The subdepartments of the selected department are displayed as a pie chart where the colours show the completion rate of the subdepartment:
- White – no data available.
- Red – 0%.
- Yellow – 50%.
- Green – 100%.
Selecting a subdepartment on the chart drills down into it.
Additionally, the same data is displayed as a table that also includes individuals in the selected department, managers, and the precise completion rates (or expiration information, if the relevant option has been selected under report options).
Note that this section is only available if your company's organization structure has been imported into the
Target employee group
In this section you can narrow down the target group by specifying the relevant filtering rules.
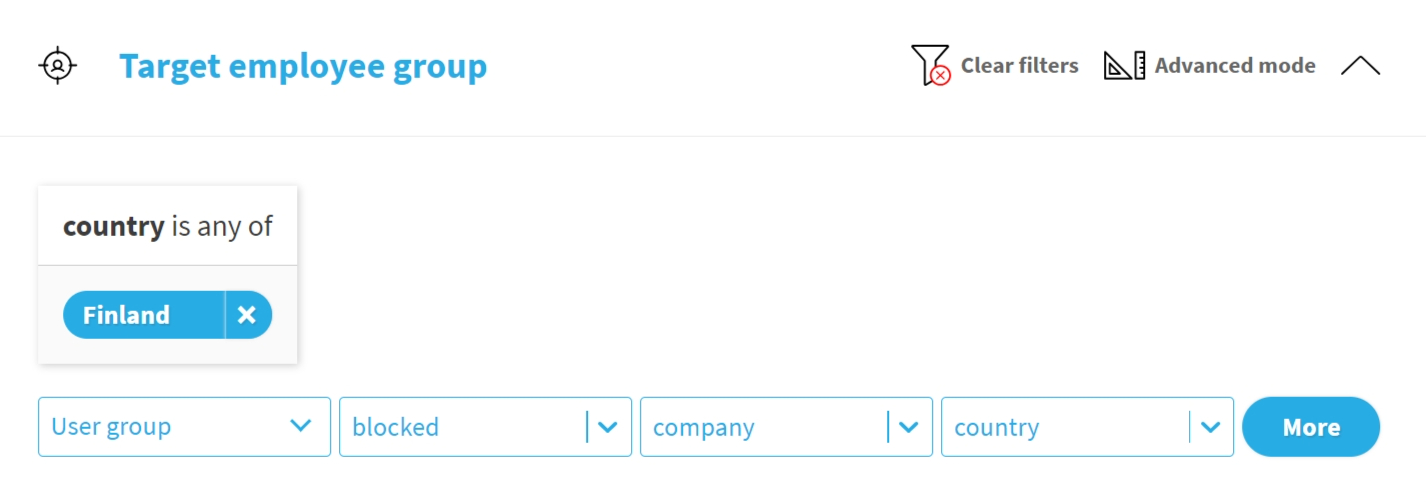
See how to use assignment for details on the filtering interface. Manual assignment is not available here.
Activity
Here you can view a bar chart of daily or monthly activity. The yellow bars show started sessions and green completed sessions on the particular day or month.
Available chart actions include:
- Monthly – toggles the monthly view.
- Grouped – toggles between grouped and stacked views.
The numbers in the graph are sessions, not users. If a user has started and completed a training on the same day, the session will be included in both started and completed, and thereby it is counted twice in the activities graph.
Aggregate results by field
Here you can view results by a user field, for example by business unit, country, or collar.
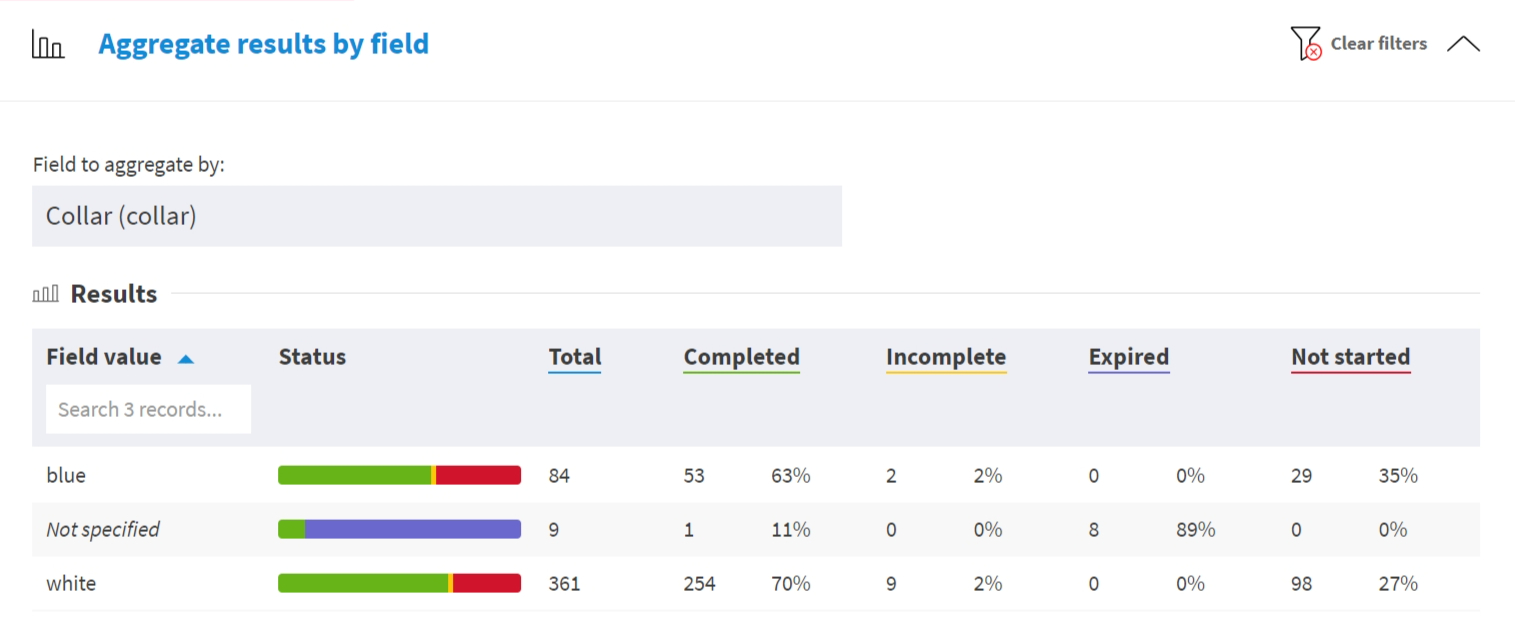
The section contains Field to aggregate by and a Results table.
The Results table shows columns such as Field value, Status, Total, Completed, Incomplete, Expired, and Not started.
Detailed results
Here you can see a list of all relevant users and their completion statuses.
The list can be downloaded in Excel format with the Download action. Because detailed results contain user data, the download opens the Select fields to include popup before the file is created.
The table shows columns such as Content, Status, Assignment, Updated or Expires, Name, and Employee ID. When content versioning is enabled, session Version can also be included in report results and downloads.
The download popup lets you choose fields and optional password encryption. User detail fields and sensitive fields must be explicitly selected when they are needed in the downloaded file. See Field selection.
Detailed aggregate results
Here you can see the list all relevant users and how many of the selected
For example, 2/3 means that the user has completed two out of the three relevant contents. Note that the amount of contents can vary per user according to the assignment status.
The list can be downloaded in Excel format with the Download action. The same field selection and optional encryption popup is used as in Detailed results.
The table shows columns such as Total, Mandatory, Recommended, Optional, Name, and Employee ID.
Aggregate completion status
Here you can see results by completion status.
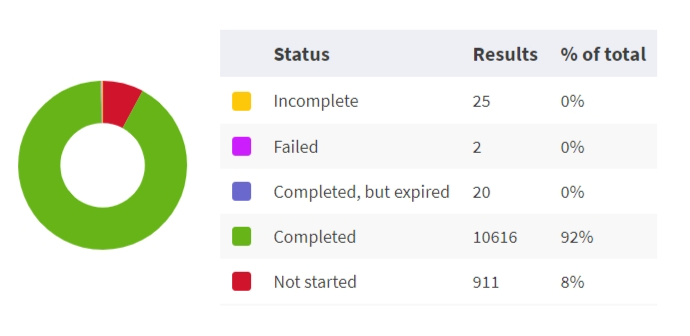
This option is most useful when viewing results for multiple contents.
The table shows columns such as Status, Results, and % of total. Completion statuses can include Not started, Incomplete, Failed, Completed, and Completed, but expired.
Report options
Here you can choose various report options:
Session options
- Include sessions created or updated between – limits sessions by created or updated date. Users who The fallback content to display on prerenderingtheThe fallback content to display on prerenderingoutside those dates are considered as not having started the training.
- Include all sessions – includes all sessions instead of only the latest relevant sessions. This can skew percentages.
Expiration
- Consider only active completions, for example not expired, as completed – expired completions are considered as Not started.
- Show only users whose completion for any selected content has expired or expires in X days – narrows results to users with expired or soon-expiring completions.
Miscellaneous
- Include results of blocked users – include blocked users in report results.
Save and schedule email report
Here you can save the report as it is currently configured and schedule it to be sent to an administrator's email address.
The scheduled report is the same that can be downloaded from the "Detailed results" section.
This section contains these tabs:
- Save report – save the report as it is currently configured.
- Scheduled reports – review or edit the existing scheduled reports.
- Schedule new report – schedule the report to be periodically sent to your email address.
Save report
Save report stores the current report parameters.
The tab contains:
- Name – the saved report name.
- Permission labels – permission labels controlling access to the saved report.
- Save as a new report and keep the old version as it is – shown when editing an existing saved report.
You can find all saved reports from the saved reports page.
Scheduled reports
Scheduled reports lists existing schedules for the saved report.
The table shows columns such as Frequency, Day, Hour, Time zone, Recipient, and Automated processing:
- Frequency – daily, weekly, or monthly.
- Day – every day, weekday, or day of month depending on the frequency.
- Hour – the hour when the report is sent.
- Time zone – the time zone used for the schedule.
- Recipient – the administrator receiving the report.
- Automated processing – whether the report is marked as being processed automatically by the recipient.
Schedule new report
Schedule new report creates a new email schedule.
The schedule form contains:
- Frequency – daily, weekly, or monthly.
- Day – weekday for weekly reports, or day of month for monthly reports.
- Hour – the hour when the report should be sent.
- Time zone – the recipient's time zone.
- Recipient – the administrator who receives the scheduled report.
- Fields to include – all fields or selected fields.
- This report is processed automatically by the recipient – marks the schedule for automated processing.
When Fields to include is set to selected fields, the Fields to include section lets you choose the fields included in the scheduled report.
The content of all reports, including those sent by email, is limited by the permissions granted to the administrator viewing (receiving) them.
For example, when a user who has access to only Finnish users views a report about the whole company, they will see results only containing the Finnish users.
If you are scheduling the report to be sent to someone else, make sure they have the relevant permissions or the report could be empty or partial.